Managing memory usage of .NET Core on AWS t2.micro
First published 21 October 2019
Over the last few months I've had issues with my server (an AWS free-tier EC2 t2.micro) going completely unresponsive, even to SSH, and needing a restart. This server gets almost zero usage (it's just a staging server for a single developer), so the common Internet wisdom of “just upgrade the instance type” didn't seem applicable. This post summarises how I tracked down the root cause and implemented a possible fix.
Initial survey
The first question is, "Why is the instance completely unresponsive?". The server (Ubuntu 18.04) runs only a handful of processes: Apache, .NET Core, and Borg.
I couldn't find anything suggesting a cause for the fault in the system logs following a restart, so the only indication of any problem was the CloudWatch metrics showing elevated CPU:
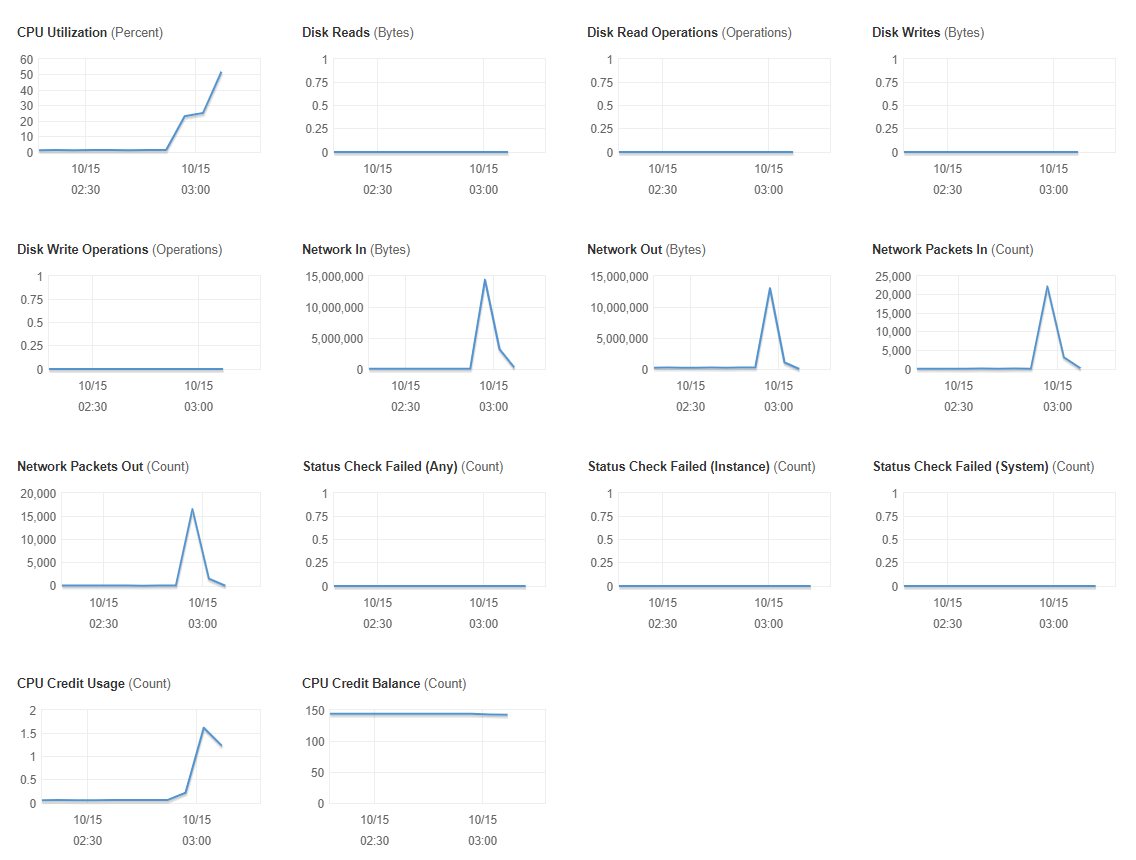
Note that the line terminates when I restart the instance. Since the CPU credit balance is still high, I know that the issue is not AWS suspending the instance due to high CPU load.
Incidentally, I had already set up high-CPU alarms to alert me to this condition, and to automatically restart the instance after a period of repeated alarms.
Investigation
The high CPU usage alone doesn't explain why the instance becomes unresponsive (as Linux should be able to multitask to some degree even under heavy load), so obviously something else was also going wrong.
My next step was to set up Filebeat monitoring of system and Apache logs, feeding into an AWS-hosted Elasticsearch and with a Kibana front-end. You can see my previous posts on getting this working. I initially assumed the issue was some kind of denial-of-service, and so I was mostly concentrating on the Apache access logs and response times.
I also set up Metricbeat in a similar fashion to try to catch which process was consuming CPU.
It was some time before the server ran into the same issue again (it was only happening once a month at most, sometimes once every 3 months). The next time it did happen thoyugh I was able to catch the CPU metrics in Kibana:
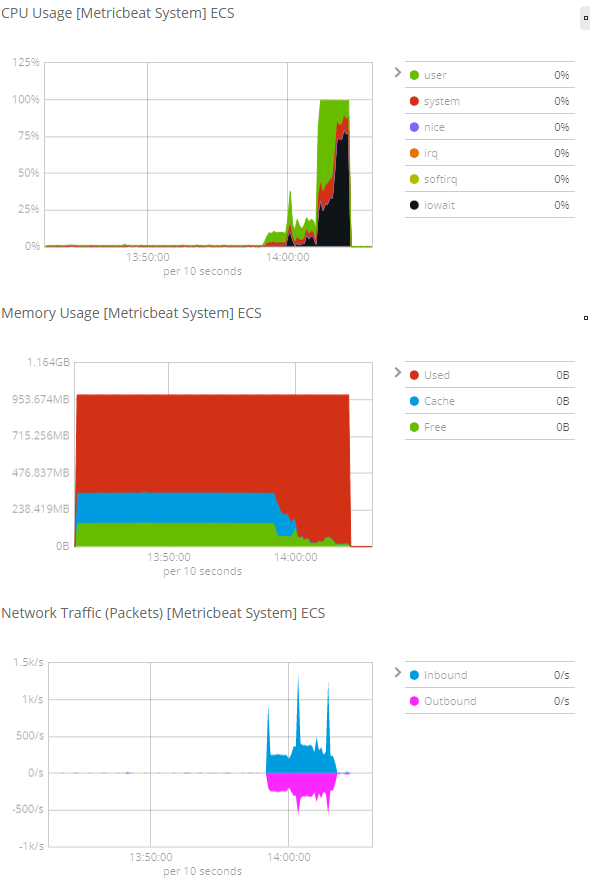
Aha! The high CPU load is being driven by iowait, during a time when memory usage is maxed out at 1 GB. This suggests that the kernel is trying to swap out memory, but is hanging while doing so. This is probably a misconfiguration in the EC2 setup. I haven't looked into this yet, as I have no desire for my server to require swapping (this would mitigate the issue behind a performance problem).
Determining which particular process is responsible for the memory pressure is a matter of configuring an appropriate Kibana visualisation:
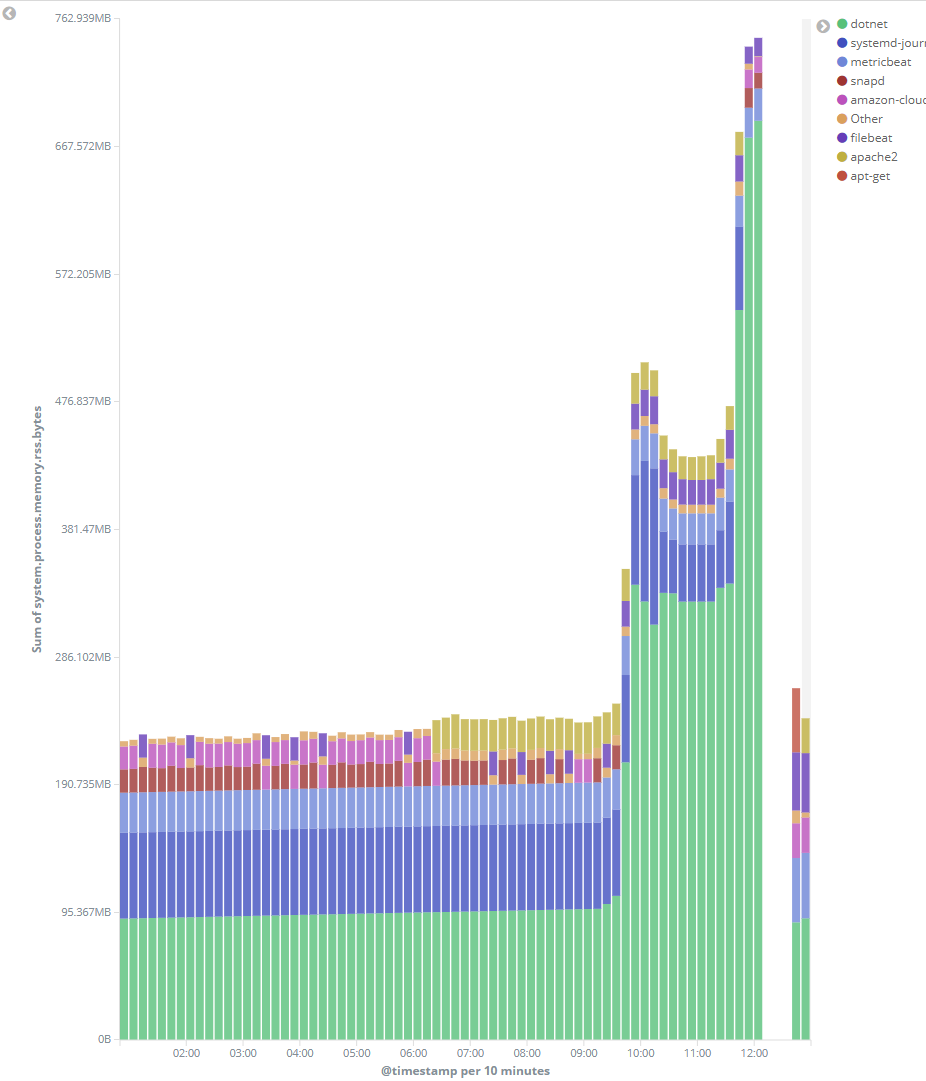
(This visualisation is from a later run, which is why the timestamps don't line up, and includes an instance restart at 12:15).
Pretty clear that dotnet (i.e., ASP .NET Core) is chewing through memory. Since the application is incredibly simple (just a front-end to a MySQL connection), this should be fixable through configuration.
Resolution
Most suggestions for dealing with .NET Core memory usage are to switch from the “server” GC model to the "workstation" GC model. This makes some sense but isn't completely satisfactory, as it doesn't really give a guarantee about upper memory limit.
Eventually I found my way to Using .NET and Docker Together, which describes how .NET Core was tuned to work within a Docker container. I have no desire to change my deployment strategy to use Docker, but the article does mention that .NET Core establishes its heap size based on the cgroup policy, which is a Linux capability that is not specific to Docker.
cgroup is not usable out of the box on Ubuntu 18.04, nor even documented. This cgroup ubuntu 18.04 howto succinctly describes how to get it set up though. I also followed along with Using Linux Control Groups to Constrain Process Memory.
Specifically, I installed cgroup-tools:
sudo apt install cgroup-tools cgroup-bin
sudo cp /usr/share/doc/cgroup-tools/examples/cgred.conf /etc/
and created a /dotnet group:
sudo cgcreate -g memory:/dotnet
and associated the group with the dotnet process in /etc/cgrules.conf
*:dotnet memory /dotnet
and set the group limits in /etc/cgconfig.conf:
group /dotnet {
    memory {
        memory.limit_in_bytes = 128m;
        memory.swappiness = 0;
    }
}
Then reload the config (see the cgroup ubuntu 18.04 howto for how to automate this as a service):
/usr/sbin/cgconfigparser -l /etc/cgconfig.conf
/usr/sbin/cgrulesengd -vvv
Now you can check which processes are assigned have been assigned to the group:
cat /sys/fs/cgroup/memory/dotnet/tasks
and the current limits/usage of the group:
cgget -g memory:/dotnet
The .NET Core process seems to notice the config change immediately and reduces its heap usage without even requiring a restart:
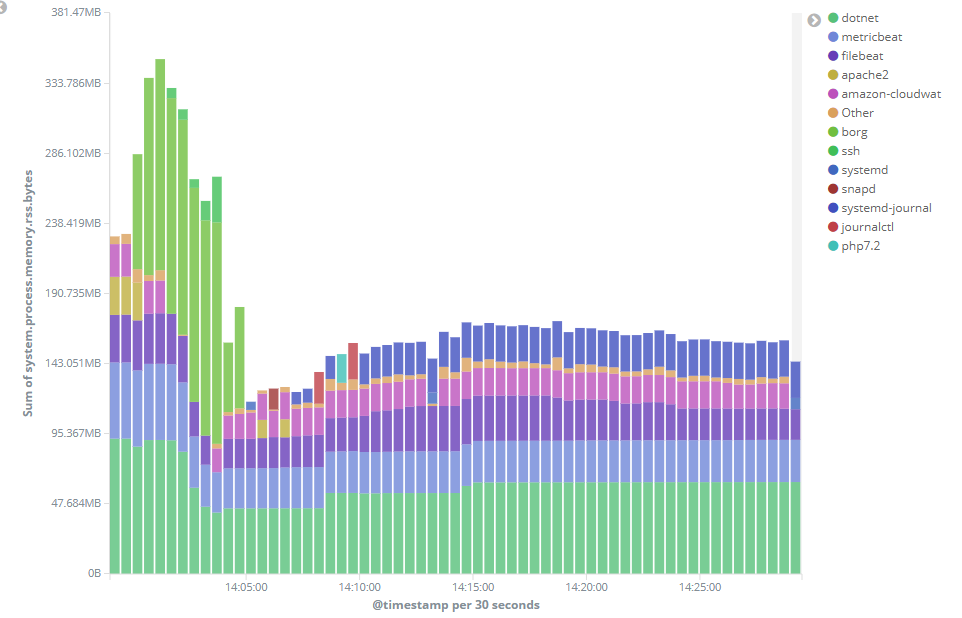
The config was applied at about 14:00 in the above chart. (Don't be distracted by the upper bars in lime green showin the Borg process, that's just an automated backup).
Conclusion
This setup has only been running for a few hours so it's far too soon to say for sure that it's working as intended, or if it has resolved the original issue, but I wanted to get it down in writing so I remember how to do it again next time!
It seems to me that assigning all major processes for the server into their own resource-limited groups would be a smart idea, and something I might experiment with later.